

学生成绩统计
创建一个包含10名学生数学成绩的Series,成绩范围在50-100之间。计算平均分、最高分、最低分,并找出高于平均分的学生人数。
import pandas as pd
import numpy as np

# 生成随机成绩
np.random.seed(42)
scores = pd.Series(np.random.randint(50, 101, 10),
                  index=['学生'+str(i) for i in range(1, 11)])

# 你的代码...
import pandas as pd
import numpy as np
# 生成随机成绩
np.random.seed(42)
scores = pd.Series(np.random.randint(50, 101, 10),
index=['学生'+str(i) for i in range(1, 11)])
# 计算统计量
mean_score = scores.mean()
max_score = scores.max()
min_score = scores.min()
above_avg = scores[scores > mean_score].count()
print(f"平均分: {mean_score:.1f}")
print(f"最高分: {max_score}")
print(f"最低分: {min_score}")
print(f"高于平均分的学生人数: {above_avg}")温度数据分析
给定某城市一周每天的最高温度Series,完成以下任务:
找出温度超过30度的天数
计算平均温度
将温度从高到低排序
找出温度变化最大的两天
temperatures = pd.Series([28, 31, 29, 32, 30, 27, 33],
                         index=['周一', '周二', '周三', '周四', '周五', '周六', '周日'])
diff
abs
nlargest()
tolist()
temperatures = pd.Series([28, 31, 29, 32, 30, 27, 33],
                         index=['周一', '周二', '周三', '周四', '周五', '周六', '周日'])

# 1. 找出温度超过30度的天数
hot_days = temperatures[temperatures > 30].count()

# 2. 计算平均温度
avg_temp = temperatures.mean()

# 3. 将温度从高到低排序
sorted_temp = temperatures.sort_values(ascending=False)

# 4. 找出温度变化最大的两天
temp_diff = temperatures.diff().abs()
max_diff_days = temp_diff.nlargest(2).index.tolist()

print(f"超过30度的天数: {hot_days}")
print(f"平均温度: {avg_temp:.1f}")
print("温度排序:\n", sorted_temp)
print(f"温度变化最大的两天: {max_diff_days}")
股票价格分析
给定某股票连续10个交易日的收盘价Series:
计算每日收益率(当日收盘价/前日收盘价 – 1)
找出收益率最高和最低的日期
计算波动率(收益率的标准差)
prices = pd.Series([102.3, 103.5, 105.1, 104.8, 106.2, 107.0, 106.5, 108.1, 109.3, 110.2],
                  index=pd.date_range('2023-01-01', periods=10))
prices = pd.Series([102.3, 103.5, 105.1, 104.8, 106.2, 107.0, 106.5, 108.1, 109.3, 110.2],
index=pd.date_range('2023-01-01', periods=10))
# 1. 计算每日收益率
returns = prices.pct_change()
# 2. 找出收益率最高和最低的日期
max_return_date = returns.idxmax()
min_return_date = returns.idxmin()
# 3. 计算波动率
volatility = returns.std()
print("每日收益率:\n", returns)
print(f"收益率最高的日期: {max_return_date}")
print(f"收益率最低的日期: {min_return_date}")
print(f"波动率: {volatility:.4f}")销售数据分析
某产品过去12个月的销售量Series:
计算季度平均销量(每3个月为一个季度)
找出销量最高的月份
计算月环比增长率
找出连续增长超过2个月的月份
sales = pd.Series([120, 135, 145, 160, 155, 170, 180, 175, 190, 200, 210, 220],
                 index=pd.date_range('2022-01-01', periods=12, freq='M'))
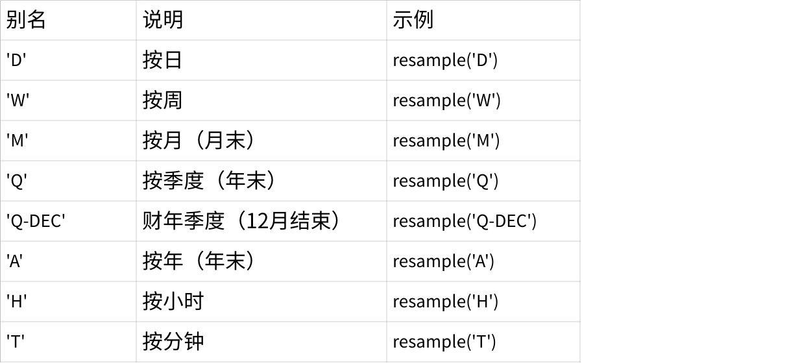
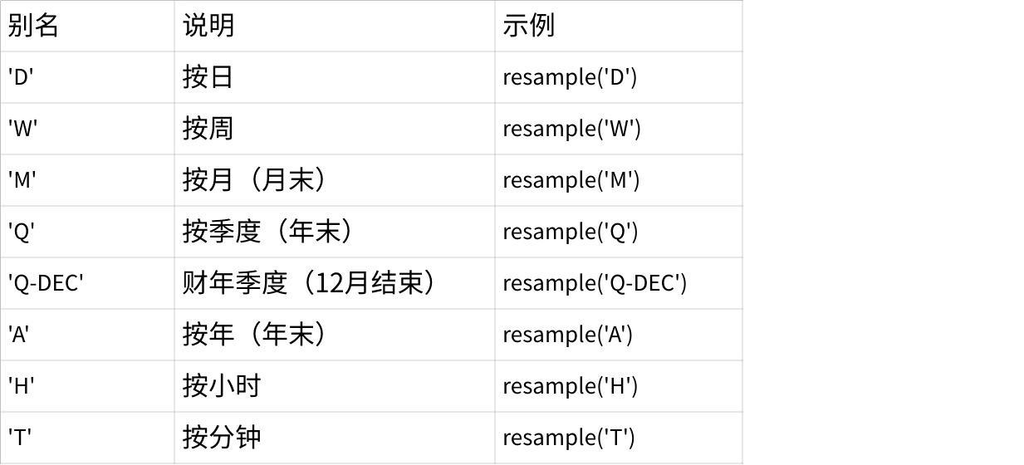
resample(‘Q’)
常用频率别名(rule 参数)
sales = pd.Series([120, 135, 145, 160, 155, 170, 180, 175, 190, 200, 210, 220],
                 index=pd.date_range('2022-01-01', periods=12, freq='M'))

# 1. 计算季度平均销量
quarterly_avg = sales.resample('Q').mean()

# 2. 找出销量最高的月份
max_sales_month = sales.idxmax()

# 3. 计算月环比增长率
mom_growth = sales.pct_change()

# 4. 找出连续增长超过2个月的月份
growth_mask = mom_growth > 0
consecutive_growth = growth_mask.rolling(3).sum() >= 2
growth_months = sales[consecutive_growth].index

print("季度平均销量:\n", quarterly_avg)
print(f"销量最高的月份: {max_sales_month}")
print("月环比增长率:\n", mom_growth)
print("连续增长超过2个月的月份:", growth_months.tolist())
数据合并与计算
有两个Series分别记录了某产品在两个城市的日销量:
计算两个城市的总日销量
找出哪个城市的销量更高
计算两个城市销量的相关系数
city_a = pd.Series([120, 135, 140, 130, 145],
                  index=pd.date_range('2023-01-01', periods=5))
city_b = pd.Series([110, 125, 150, 140, 130],
                  index=pd.date_range('2023-01-01', periods=5))
答案:
city_a = pd.Series([120, 135, 140, 130, 145],
                  index=pd.date_range('2023-01-01', periods=5))
city_b = pd.Series([110, 125, 150, 140, 130],
                  index=pd.date_range('2023-01-01', periods=5))

# 1. 计算两个城市的总日销量
total_sales = city_a + city_b

# 2. 找出哪个城市的销量更高
city_a_total = city_a.sum()
city_b_total = city_b.sum()
higher_sales_city = 'A' if city_a_total > city_b_total else 'B'

# 3. 计算两个城市销量的相关系数
correlation = city_a.corr(city_b)

print("总日销量:\n", total_sales)
print(f"总销量更高的城市: {higher_sales_city}")
print(f"两个城市销量的相关系数: {correlation:.2f}")
© 版权声明
文章版权归作者所有,未经允许请勿转载。
THE END











请登录后查看评论内容