

5.1 使用 Python 实现模型的训练
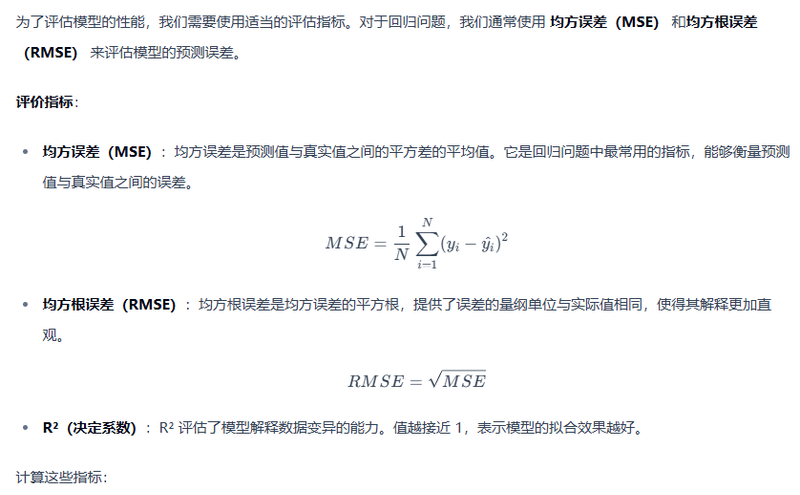
我们将使用 Gradient Boosting Regressor(梯度提升回归模型)来进行房价预测,并评估其性能。
首先,我们需要完成:
- 数据预处理:我们已经对数据进行了清洗和特征工程,确保数据适合训练。由于数值特征的取值范围不同(如
LotArea可能是几千,而OverallQual只有 1-10),我们需要对数据进行标准化或归一化。 - 模型训练:我们使用
GradientBoostingRegressor模型来进行训练。
from sklearn.ensemble import GradientBoostingRegressor
from sklearn.model_selection import train_test_split
from sklearn.metrics import mean_squared_error
from sklearn.preprocessing import StandardScaler
import numpy as np

# 设定特征变量和目标变量
X = df_selected.drop(columns=['SalePrice'])
y = df_selected['SalePrice']

# 划分数据集
X_train, X_test, y_train, y_test = train_test_split(X, y, test_size=0.2, random_state=42)

# 标准化:先 fit 训练集,再 transform 测试集
scaler = StandardScaler()
X_train_scaled = scaler.fit_transform(X_train)
X_test_scaled = scaler.transform(X_test)

# 初始化并训练模型
gbr_model = GradientBoostingRegressor(n_estimators=100, learning_rate=0.1, max_depth=3, random_state=42)
gbr_model.fit(X_train_scaled, y_train)

# 预测与评估
y_pred_gbr = gbr_model.predict(X_test_scaled)
rmse_gbr = np.sqrt(mean_squared_error(y_test, y_pred_gbr))

print(f"Gradient Boosting Regression RMSE (Standardized): {rmse_gbr:.4f}")
5.2 评估模型性能
from sklearn.metrics import mean_squared_error, r2_score

# 计算 MSE 和 RMSE
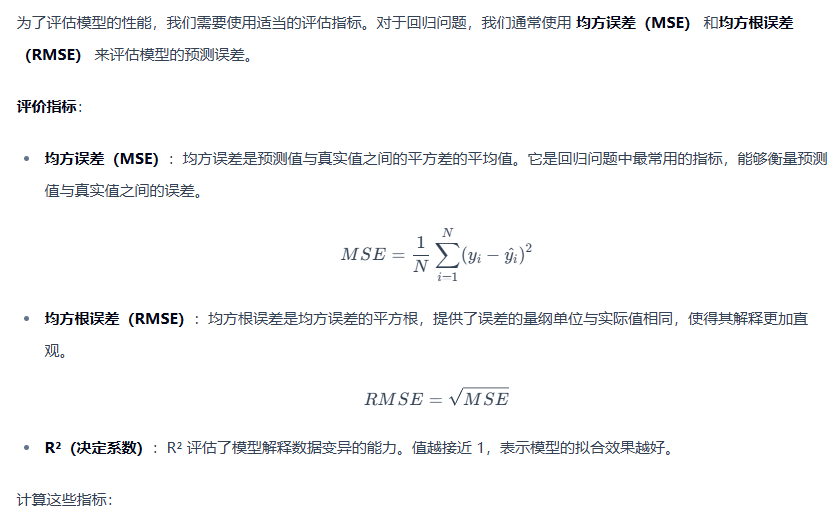
mse_gbr = mean_squared_error(y_test, y_pred_gbr)
rmse_gbr = np.sqrt(mse_gbr)

# 计算 R²(决定系数)
r2_gbr = r2_score(y_test, y_pred_gbr)

print(f"Gradient Boosting Regression MSE: {mse_gbr}")
print(f"Gradient Boosting Regression RMSE: {rmse_gbr}")
print(f"Gradient Boosting Regression R²: {r2_gbr}")
5.3 优化模型参数
为了提升模型的性能,我们可以使用 网格搜索(GridSearchCV) 或随机搜索(RandomizedSearchCV) 来进行超参数调优。
5.3.1 网格搜索
网格搜索是一种穷举搜索方法,它会尝试所有可能的超参数组合,并评估每个组合的模型性能。
from sklearn.model_selection import GridSearchCV

# 设置参数网格
param_grid = {
    'n_estimators': [100, 200, 300],
    'learning_rate': [0.05, 0.1, 0.2],
    'max_depth': [3, 4, 5]
}

# 初始化梯度提升回归模型
gbr_model = GradientBoostingRegressor(random_state=42)

# 使用网格搜索调参
grid_search = GridSearchCV(estimator=gbr_model, param_grid=param_grid, cv=5, scoring='neg_mean_squared_error', verbose=1, n_jobs=-1)

# 训练模型
grid_search.fit(X_train, y_train)

# 输出最优参数和最优评分
print(f"Best Parameters: {grid_search.best_params_}")
print(f"Best Score: {grid_search.best_score_}")
5.3.2 随机搜索
随机搜索是一种更高效的搜索方法,通过在预定义的参数范围内随机选择一部分超参数进行评估,通常能比网格搜索节省时间。
from sklearn.model_selection import RandomizedSearchCV
from scipy.stats import uniform

# 设置参数分布
param_dist = {
    'n_estimators': [100, 200, 300],
    'learning_rate': uniform(0.01, 0.2),
    'max_depth': [3, 4, 5]
}

# 初始化梯度提升回归模型
gbr_model = GradientBoostingRegressor(random_state=42)

# 使用随机搜索调参
random_search = RandomizedSearchCV(estimator=gbr_model, param_distributions=param_dist, n_iter=10, cv=5, scoring='neg_mean_squared_error', verbose=1, n_jobs=-1, random_state=42)

# 训练模型
random_search.fit(X_train, y_train)

# 输出最优参数和最优评分
print(f"Best Parameters: {random_search.best_params_}")
print(f"Best Score: {random_search.best_score_}")
5.4 可视化模型评估结果
为了更好地理解模型的表现,我们可以通过可视化手段来展示模型的预测效果。例如,使用 散点图 比较真实房价与预测房价,或者使用残差图 来分析预测误差。
散点图:真实房价与预测房价对比
import matplotlib.pyplot as plt

# 绘制真实值与预测值的散点图
plt.figure(figsize=(8, 6))
plt.scatter(y_test, y_pred_gbr, color='b', alpha=0.6)
plt.plot([y_test.min(), y_test.max()], [y_test.min(), y_test.max()], color='r', linestyle='--')
plt.xlabel('True Values')
plt.ylabel('Predicted Values')
plt.title('True vs Predicted House Prices')
plt.show()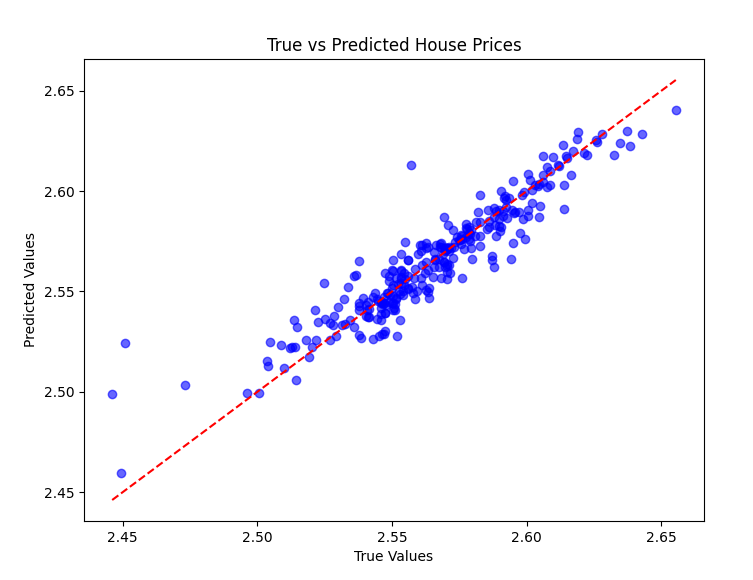
残差图:
# 计算残差
residuals = y_test - y_pred_gbr

# 绘制残差图
plt.figure(figsize=(8, 6))
plt.scatter(y_pred_gbr, residuals, color='b', alpha=0.6)
plt.hlines(y=0, xmin=y_pred_gbr.min(), xmax=y_pred_gbr.max(), color='r', linestyle='--')
plt.xlabel('Predicted Values')
plt.ylabel('Residuals')
plt.title('Residuals vs Predicted House Prices')
plt.show()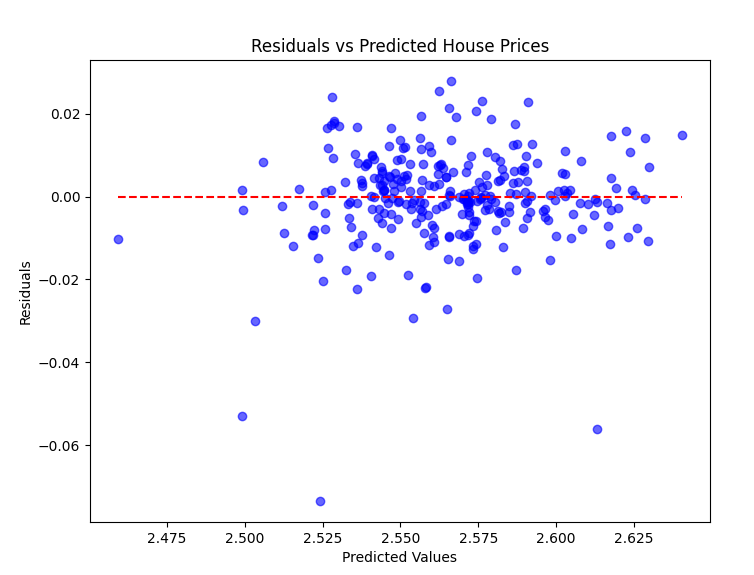
5.5 小结
- 模型训练:我们使用
GradientBoostingRegressor进行训练,评估模型性能。 - 评估指标:通过计算** 均方误差(MSE)、 均方根误差(RMSE)和 决定系数(R²)** 来评估模型的表现。
- 超参数调优:通过网格搜索(GridSearchCV) 和随机搜索(RandomizedSearchCV) 来优化模型的超参数。
- 可视化:使用散点图 和残差图 进行可视化,以更好地理解模型的表现。
© 版权声明
文章版权归作者所有,未经允许请勿转载。
THE END











请登录后查看评论内容