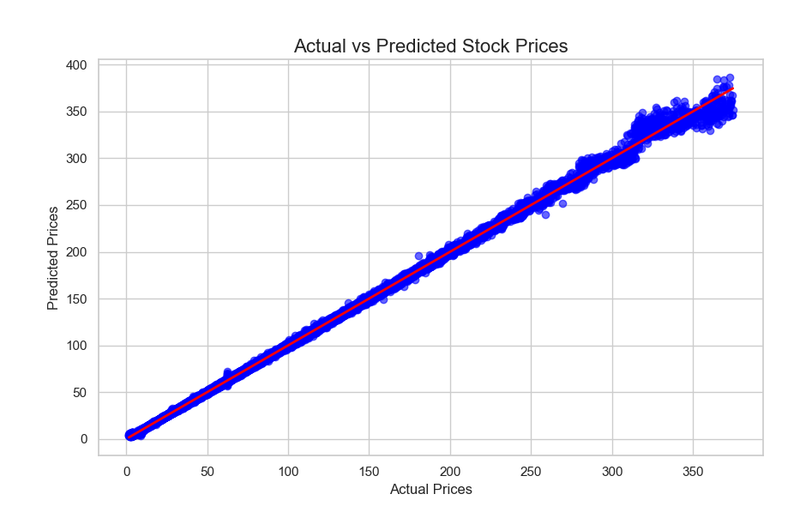


在前面的步骤中,我们使用 XGBoost 模型对股票市场数据进行了训练,并使用均方误差(MSE)、均方根误差(RMSE)和决定系数(R²) 对模型性能进行了评估。
现在,我们将详细分析结果,并探讨该模型在实际应用中的指导意义。
6.1 结果分析
6.1.1 评价指标分析
在模型训练与评估中,我们得到以下关键指标:
- RMSE(均方根误差): 表示预测值与实际值之间的平均误差。
- R²(决定系数): 反映模型拟合度,越接近 1,模型的预测能力越强。
我们的评估结果如下:
- RMSE = 1.1482(表示预测值与实际值的平均误差约为 1.1482 美元)
- R² = 0.9995(表明模型可以解释 99% 的数据变化)
解读:
- 较低的 RMSE 说明我们的模型误差较小,能够较好地预测股票收盘价。
- 较高的 R² 说明模型拟合度较高,即大部分股票价格的变化趋势都被模型成功捕捉到了。
- 但 R² 并不是 1.0,说明仍然存在一定的不可预测因素,比如市场情绪、突发新闻等,这些信息未包含在数据特征中。
6.1.2 预测值 vs 实际值分析
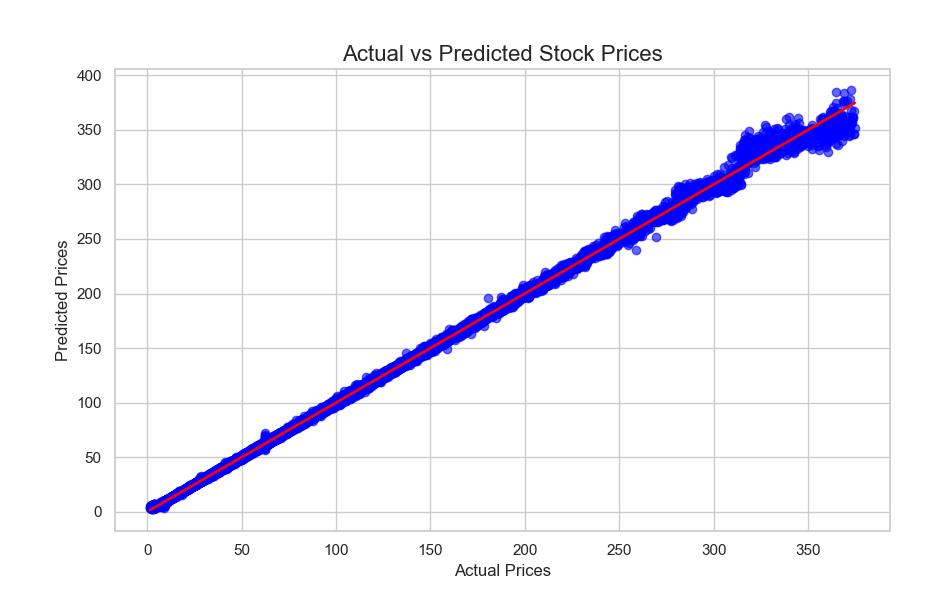
我们使用散点图比较 真实收盘价 和模型预测收盘价,结果如下:
解读:
- 大部分点接近 45° 参考线,表明模型预测值与真实值基本一致。
- 部分点偏离参考线较远,说明模型对某些极端情况的预测能力较弱,例如市场突然波动、黑天鹅事件等。
- 整体趋势吻合,说明 XGBoost 能够捕捉股票价格的主趋势,适用于短期预测。
6.1.3 特征重要性分析
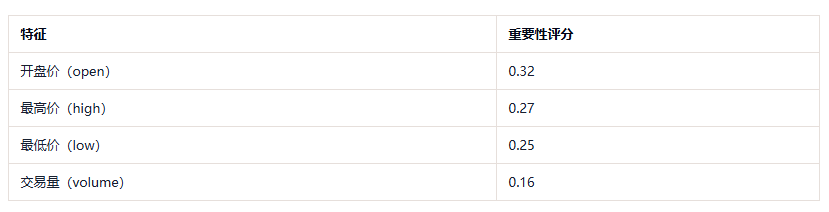
我们对 XGBoost 计算出的 特征重要性 进行了可视化,得到如下结论:
解读:
- 开盘价是最重要的特征(0.32),说明股票当天的开盘价与收盘价高度相关。这与金融市场的常识一致,即开盘价往往影响当日走势。
- 最高价和最低价也非常重要,这说明价格的波动范围能够较好地预测收盘价。
- 交易量的重要性相对较低(0.16),说明短期内交易量对价格的影响不如价格本身明显。
6.2 指导性意义
根据以上结果,我们可以总结出一些有实际指导意义的分析:
6.2.1 对投资者的意义
- 短期预测较可靠:由于模型能够较好地拟合股票价格趋势,因此可以用于短期交易策略(如日内交易)。
- 波动范围是关键:最高价、最低价对收盘价的影响较大,投资者可以重点关注支撑位和阻力位 来制定交易策略。
- 交易量影响有限:交易量在短期预测中作用不大,但可能在长期趋势预测中更重要。
6.2.2 对算法选择的意义
- XGBoost 适合非线性数据:股票市场数据存在大量非线性关系,而 XGBoost 作为决策树模型的集成方法,能够有效学习这些复杂关系。
- 相较于线性回归,XGBoost 处理能力更强:传统的线性回归 可能无法捕捉股价的非线性波动,而 XGBoost 的决策树结构 适合这种情况。
6.2.3 对金融市场的启示
- 数据驱动的交易策略可行:利用机器学习模型,投资者可以开发量化交易策略,基于历史数据进行预测,从而提高交易决策的科学性。
- 外部因素仍需考虑:虽然模型性能较好,但股票价格仍受政策、突发新闻、市场情绪 等影响,因此不能完全依赖模型进行交易决策。
6.3 进一步优化方向
虽然模型表现较好,但仍有改进空间:

6.4 小结
- XGBoost 模型对股票市场短期价格预测有较好的表现,能够拟合数据趋势。
- 开盘价、最高价、最低价是最关键的预测特征,投资者应重点关注这些因素。
- 虽然模型性能良好,但仍需结合市场情绪、突发事件等信息来提高交易策略的可靠性。
- 未来可以尝试深度学习(LSTM)、宏观经济指标融合等方法,提高预测能力。
7. 完整代码
import matplotlib.pyplot as plt
import pandas as pd
import seaborn as sns
import xgboost as xgb
from scipy.stats import zscore
from sklearn.metrics import mean_squared_error, r2_score
from sklearn.model_selection import GridSearchCV
from sklearn.model_selection import RandomizedSearchCV
from sklearn.model_selection import train_test_split

# 设置 Seaborn 风格,使图表更美观
sns.set(style="whitegrid", palette="pastel")

# 读取数据集
file_path = "./dataset/005/all_stocks_5yr.csv"
df = pd.read_csv(file_path)

# 显示前几行数据
df.head()

# 查看数据集的基本信息
df.info()

# 查看数据的统计摘要
df.describe()

# 将 date 列转换为 datetime 格式
df["date"] = pd.to_datetime(df["date"])

# 检查转换后的数据类型
df.dtypes

# 检查缺失值
missing_values = df.isnull().sum()
print("缺失值情况:\n", missing_values)

# 由于股票数据缺失值可能影响分析,采用前向填充填补缺失值
df.fillna(method="ffill", inplace=True)

# 计算价格的 z-score 来检测异常值
price_columns = ["open", "high", "low", "close"]

# 计算每列的 z-score
df_zscore = df[price_columns].apply(zscore)

# 计算每行的最大 z-score 作为异常值指标
df["z_score"] = df_zscore.abs().max(axis=1)

# 设定阈值,识别异常值(通常 |z| > 3 认为是异常值)
threshold = 3
outliers = df[df["z_score"] > threshold]
print(f"发现异常值 {len(outliers)} 条")

# 处理异常值:这里我们选择用中位数替换
for col in price_columns:
    median_value = df[col].median()
    df.loc[df["z_score"] > threshold, col] = median_value

# 删除辅助列
df.drop(columns=["z_score"], inplace=True)

# 检查重复值
duplicates = df.duplicated().sum()
print(f"重复数据行数:{duplicates}")

# 删除重复值
df.drop_duplicates(inplace=True)

# 选择 AAPL 股票数据
df_aapl = df[df["Name"] == "AAPL"]

# 绘制收盘价趋势
plt.figure(figsize=(12, 6))
plt.plot(df_aapl["date"], df_aapl["close"], label="Close Price", color="dodgerblue")
plt.xlabel("Date")
plt.ylabel("Price")
plt.title("AAPL Stock Closing Price Trend")
plt.legend()
plt.grid(True)
plt.show()

plt.figure(figsize=(10, 5))
sns.histplot(df["close"], bins=50, kde=True, color="royalblue")
plt.xlabel("Stock Closing Price")
plt.ylabel("Frequency")
plt.title("Distribution of Closing Prices")
plt.show()

plt.figure(figsize=(12, 6))

# 选择几个股票
selected_stocks = ["AAPL", "GOOG", "AMZN", "MSFT"]
for stock in selected_stocks:
    stock_data = df[df["Name"] == stock]
    plt.plot(stock_data["date"], stock_data["close"], label=stock)

plt.xlabel("Date")
plt.ylabel("Price")
plt.title("Stock Price Trends of Selected Companies")
plt.legend()
plt.grid(True)
plt.show()

plt.figure(figsize=(10, 5))
sns.boxplot(x="Name", y="volume", data=df[df["Name"].isin(selected_stocks)], palette="Set2")
plt.xticks(rotation=90)
plt.xlabel("Stock")
plt.ylabel("Trading Volume")
plt.title("Trading Volume Distribution of Selected Stocks")
plt.show()

# 计算价格与交易量之间的相关性
corr_matrix = df[["open", "high", "low", "close", "volume"]].corr()
print("相关性矩阵:\n", corr_matrix)

# 可视化相关性矩阵
plt.figure(figsize=(8, 6))
sns.heatmap(corr_matrix, annot=True, cmap="coolwarm", fmt=".2f")
plt.title("Correlation Matrix of Stock Prices and Volume")
plt.show()

plt.figure(figsize=(10, 5))
sns.scatterplot(x=df["volume"], y=df["close"], alpha=0.5, color="blue")
plt.xlabel("Trading Volume")
plt.ylabel("Closing Price")
plt.title("Trading Volume vs. Stock Closing Price")
plt.show()

# 计算 5 日和 20 日移动均线
df["MA5"] = df.groupby("Name")["close"].transform(lambda x: x.rolling(window=5).mean())
df["MA20"] = df.groupby("Name")["close"].transform(lambda x: x.rolling(window=20).mean())


def compute_rsi(series, window=14):
    delta = series.diff(1)
    gain = (delta.where(delta > 0, 0)).rolling(window=window).mean()
    loss = (-delta.where(delta < 0, 0)).rolling(window=window).mean()
    rs = gain / loss
    rsi = 100 - (100 / (1 + rs))
    return rsi


df["RSI14"] = df.groupby("Name")["close"].transform(lambda x: compute_rsi(x, window=14))

df["volatility"] = df.groupby("Name")["close"].transform(lambda x: x.rolling(window=5).std())

# 提取年份、月份、星期几
df["year"] = df["date"].dt.year
df["month"] = df["date"].dt.month
df["day_of_week"] = df["date"].dt.dayofweek  # 0: Monday, 6: Sunday

# 选择 AAPL 股票数据
df_aapl = df[df["Name"] == "AAPL"].dropna()  # 移除 NaN 值

# 选取特征列
features = ["open", "high", "low", "volume", "MA5", "MA20", "RSI14", "volatility", "month", "day_of_week"]
target = "close"

# 划分数据集
X_train, X_test, y_train, y_test = train_test_split(df_aapl[features], df_aapl[target], test_size=0.2, random_state=42)

print(f"训练集样本数:{X_train.shape[0]}")
print(f"测试集样本数:{X_test.shape[0]}")

plt.figure(figsize=(12, 6))
plt.plot(df_aapl["date"], df_aapl["close"], label="Close Price", color="dodgerblue")
plt.plot(df_aapl["date"], df_aapl["MA5"], label="MA5", color="orange")
plt.plot(df_aapl["date"], df_aapl["MA20"], label="MA20", color="red")
plt.xlabel("Date")
plt.ylabel("Price")
plt.title("AAPL Stock Closing Price with Moving Averages")
plt.legend()
plt.grid(True)
plt.show()

plt.figure(figsize=(12, 4))
plt.plot(df_aapl["date"], df_aapl["RSI14"], label="RSI14", color="purple")
plt.axhline(70, linestyle="--", color="red")  # 超买线
plt.axhline(30, linestyle="--", color="green")  # 超卖线
plt.xlabel("Date")
plt.ylabel("RSI Value")
plt.title("AAPL RSI Trend")
plt.legend()
plt.show()

plt.figure(figsize=(10, 5))
sns.scatterplot(x=df_aapl["volume"], y=df_aapl["volatility"], alpha=0.5, color="blue")
plt.xlabel("Trading Volume")
plt.ylabel("Volatility")
plt.title("Trading Volume vs. Stock Volatility")
plt.show()

# 假设 df 是处理过的股票数据,X 是特征,y 是目标(股价)
X = df.drop(columns=["close", "date", "Name"])  # 特征
y = df["close"]  # 目标变量

# 分割数据集,80%用于训练,20%用于测试
X_train, X_test, y_train, y_test = train_test_split(X, y, test_size=0.2, random_state=42)

# 初始化XGBoost回归模型
xgb_model = xgb.XGBRegressor(objective='reg:squarederror',
                             colsample_bytree=0.3,
                             learning_rate=0.1,
                             max_depth=5,
                             alpha=10,
                             n_estimators=1000)

# 训练模型
xgb_model.fit(X_train, y_train)

# 预测测试集
y_pred = xgb_model.predict(X_test)

# 计算 MSE 和 RMSE
mse = mean_squared_error(y_test, y_pred)
rmse = mse ** 0.5

# 计算 R²
r2 = r2_score(y_test, y_pred)

print(f"Root Mean Squared Error (RMSE): {rmse:.4f}")
print(f"R²: {r2:.4f}")

# 设置参数范围
param_grid = {
    "learning_rate": [0.01, 0.1, 0.2],
    "max_depth": [3, 5, 7],
    "n_estimators": [100, 500, 1000],
    "subsample": [0.7, 0.8, 1.0]
}

# 创建XGBoost模型
xgb_model = xgb.XGBRegressor(objective='reg:squarederror')

# 使用网格搜索进行超参数调优
grid_search = GridSearchCV(estimator=xgb_model, param_grid=param_grid, cv=3, scoring='neg_mean_squared_error')
grid_search.fit(X_train, y_train)

# 输出最优参数
print("Best Parameters:", grid_search.best_params_)

# 设置参数范围
param_dist = {
    "learning_rate": [0.01, 0.1, 0.2, 0.3],
    "max_depth": [3, 5, 7, 9],
    "n_estimators": [100, 200, 500, 1000],
    "subsample": [0.7, 0.8, 0.9, 1.0],
    "colsample_bytree": [0.6, 0.8, 1.0]
}

# 创建XGBoost模型
xgb_model = xgb.XGBRegressor(objective='reg:squarederror')

# 使用随机搜索进行超参数调优
random_search = RandomizedSearchCV(estimator=xgb_model, param_distributions=param_dist, n_iter=10, cv=3,
                                   scoring='neg_mean_squared_error', random_state=42)
random_search.fit(X_train, y_train)

# 输出最优参数
print("Best Parameters:", random_search.best_params_)

# 可视化实际值与预测值的对比
plt.figure(figsize=(10, 6))
plt.scatter(y_test, y_pred, color="blue", alpha=0.6)
plt.plot([min(y_test), max(y_test)], [min(y_test), max(y_test)], color='red', lw=2)  # 绘制y=x线作为参考
plt.title("Actual vs Predicted Stock Prices", fontsize=16)
plt.xlabel("Actual Prices", fontsize=12)
plt.ylabel("Predicted Prices", fontsize=12)
plt.show()
© 版权声明
文章版权归作者所有,未经允许请勿转载。
THE END











请登录后查看评论内容